UK property market update: Week 36, 2025
Here are the UK property market stats for Week 36 of 2025, covering new listings, price reductions, sales activity, stock levels, and rental trends - giving a clear snapshot of how the housing market is performing compared to last year and pre-Covid averages.
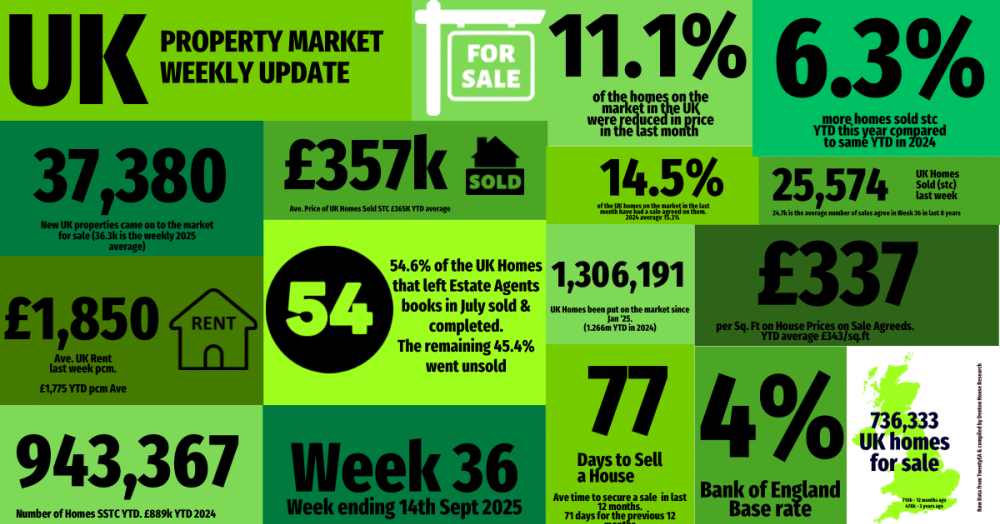
These are the UK Property Market stats for week 36 of 2025
✅ New Listings
• 37.4k new homes came to market this week, up from 36.8k last week.
• 2025 weekly average: 36.2k.
• Year-to-date (YTD): 1.30m new listings, 3.1% higher than 2024 YTD and 10.7% above the 2017–19 average.
✅ Price Reductions
• 25.6k reductions this week, similar to last week at 25.7k.
• Only 11.1% of homes were reduced in August, compared with 14.1% in July and 14% in June.
• 2025 average so far: 13.1%, versus the five-year long-term average of 10.7%.
✅ Sales Agreed
• 25.6k homes sold subject to contract this week, up from 24.9k last week.
• Weekly average for 2025: 26.2k.
• YTD: 943k, which is 6.2% ahead of 2024 and 13.6% above the 2017–19 average.
✅ Sell-Through Rate
• 14.5% of homes on agents’ books went SSTC in August.
• Down from 15.4% in July, 15.3% in June, and 16.1% in May.
• Pre-Covid average: 15.5%.
✅ Fall-Throughs
• 6,347 fall-throughs last week (pipeline of 510k home Sold STC).
• Weekly average for 2025: 6,216.
• Fall-through rate: 24.8%, up from 25.8% last week.
• Long-term average: 24.2% (post-Truss chaos saw levels exceed 40%).
✅ Net Sales
• 19.2k net sales this week, up from 18.5k last week.
• Nine-year Week 36 average: 18.5k.
• Weekly average for 2025: 20k.
• YTD: 720k, which is 5.2% ahead of 2024 (684k) and 10.1% above 2017–19 (654k).
✅ Probability of Selling (% that Exchange vs withdrawal)
• Preliminary August: 55.1% of homes that left agents’ books exchanged & completed.
• July: 50.9% / June: 51.3% / May: 51.7% / April: 53.2%.
✅ Stock Levels (1st of Month)
• 736k homes on the market at the start of September, 6.7% higher than Sept 2024.
• 510k homes in pipelines, 3.4% higher than August 2024.
✅ House Prices (£/sq.ft)
• August 2025 agreed sales averaged £338.78 per sq.ft.
• 1.41% higher than August 2024, and 14.25% higher than August 2020.
✅ Rental Market (in arrears)
• August 2025 average rent: £1,828 pcm (vs £1,779 pcm in August 2024).
• YTD 2025 average: £1,776 pcm.
If you would like to chat about our local property market, feel free to drop me a call on 01282 772048 or email me on info@pendlehillproperties.co.uk