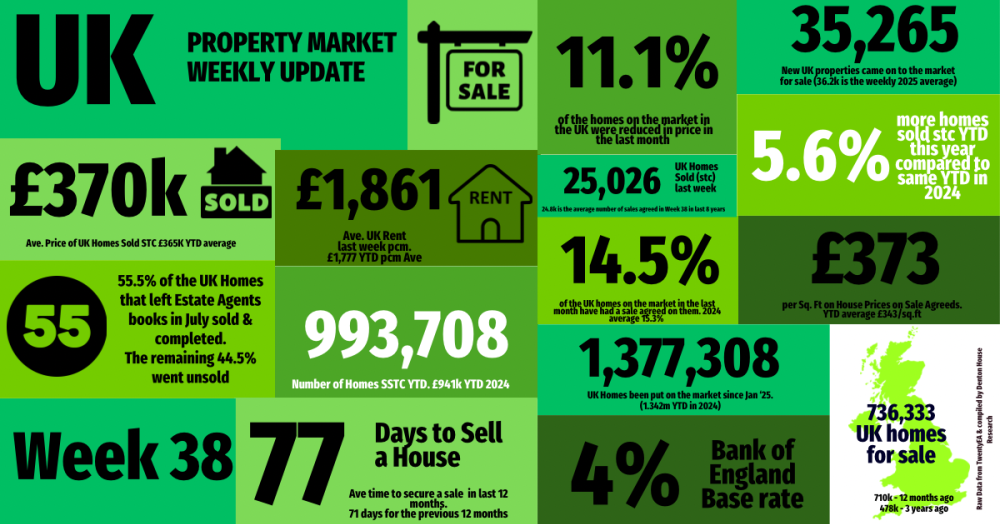
UK property market update: Week 38, 2025
The UK property market in week 38 of 2025 remains steady, with new listings and sales close to seasonal norms. While stock levels are rising, demand is holding firm, keeping activity above long-term averages and highlighting a resilient market as we head into autumn.
✅ New Listings
• 35.3k new properties came to market this week, slightly down from 35.9k last week.
• 2025 weekly average: 36.2k.
• Nine year week 37 average :34.2k
• Year-to-date (YTD): 1.38m new listings, 2.6% higher than 2024 YTD (1.34m) and 10.5% above the 2017–19 average (1.25m)
✅ Price Reductions
• 25k reductions this week, slightly higher to last week at 26.2k.
• Only 11.1% of homes were reduced in August, compared with 14.1% in July and 14% in June. (Sept figures to follow next week)
• 2025 average so far: 13.1%, versus the five-year long-term average of 10.7%.
✅ Sales Agreed
• 25k homes sold subject to contract this week, slightly down from 25.3k last week.
• Week 38 average (for last 9 years) :24.8k
• 2025 weekly average : 26.1k.
• YTD: 994k gross sales, which is 5.6% ahead of 2024 (941k) and 13.4% above the 2017–19 average (876k).
✅ Sell-Through Rate
• 14.5% of homes on agents’ books went SSTC in August. (Sept figures to follow next week)
• Down from 15.4% in July, 15.3% in June, and 16.1% in May.
• Pre-Covid average: 15.5%.
✅ Fall-Throughs
• 6,149 fall-throughs last week (pipeline of 510k home Sold STC).
• Weekly average for 2025: 6,217.
• Fall-through rate: 24.6%, down from 25% last week.
• Long-term average: 24.2% (post-Truss chaos saw levels exceed 40%).
✅ Net Sales
• 18.9k net sales this week, slightly down from 19k last week.
• Nine-year Week 38 average: 18.7k.
• Weekly average for 2025: 19.9k.
• YTD: 757k, which is 4.8% ahead of 2024 (723k) and 10% above 2017–19 (688k).
✅ Probability of Selling (% that Exchange vs withdrawal)
• August: 55.5% of homes that left agents’ books exchanged & completed.
• July: 50.9% / June: 51.3% / May: 51.7% / April: 53.2%.
✅ Stock Levels
• 736k homes on the market at the start of September, 6.7% higher than Sept 2024.
• 510k homes in sales pipelines, 3.4% higher than August 2024.
✅ House Prices (£/sq.ft)
• August 2025 agreed sales averaged £338.78 per sq.ft.
• 1.41% higher than August 2024, and 14.25% higher than August 2020.
✅ Rental Market
• September 2025 average rent: £1,854 pcm (vs £1,792 pcm in Sept 2024) - a rise of 3.46%
• YTD 2025 average: £1,780 pcm.
• 126k rental properties came on the market in Sept 2025, compared to 101k in Sept ’24, 110k in Sept ’23 & 127k in Aug ’19
If you would like to chat about our local property market, feel free to drop me a call on 01282 772048 or email me at info@pendlehillproperties.co.uk