UK property market update: Week 39, 2025
The UK property market remains steady as we enter October. New listings dipped slightly to 34.3k, matching the long-term average, while sales and net sales held firm. With stock levels 4% higher year-on-year, the market shows resilience. Read the blog below to find out more!
✅ New Listings
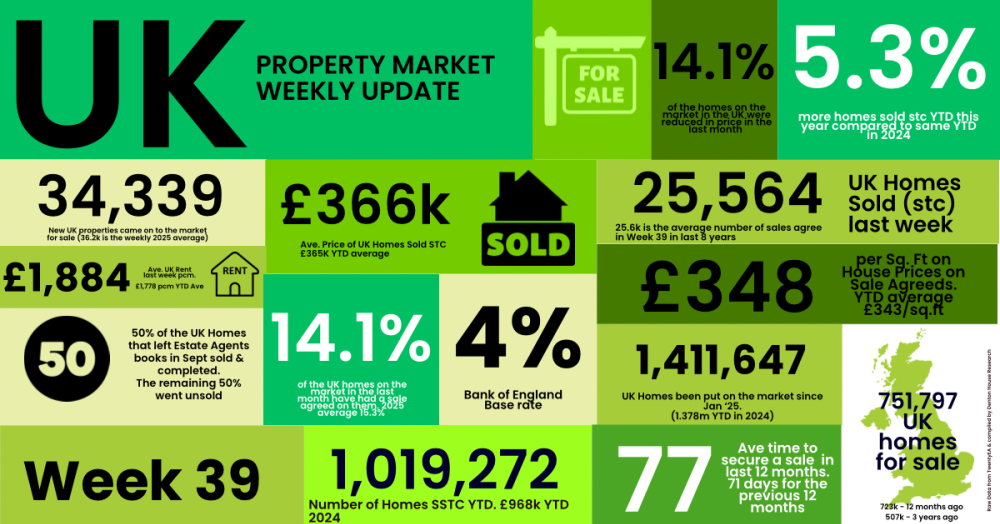
• 34.3k new properties came to market this week, down as expected from 35.3k last week.
• 2025 weekly average: 36.2k.
• Nine year week 39 average :34.3k
• Year-to-date (YTD): 1.41m new listings, 2.4% higher than 2024 YTD (1.38m) and 10% above the 2017–19 average (1.28m)
✅ Price Reductions
• 25.6k reductions this week, slightly higher to last week at 25k.
• Increase in the number of homes on the market being reduced in September to 14.1%. In August, it was 11.1% (everyone must have been on holiday!), whilst it was 14.1% in July and 14% in June.
•2025 average so far: 13.2%, versus the five-year long-term average of 10.74%.
✅ Sales Agreed
• 25.6k homes sold subject to contract this week, up from 25k last week.
• Week 39 average (for last 9 years) :25.7k
• 2025 weekly average : 26.1k.
•YTD: 1.019m gross sales, which is 5.3% ahead of 2024 (968k) and 13.3% above the 2017 - 19 average (899k).
✅ Sell-Through Rate
• 14.1% of homes on agents’ books went SSTC in September.
• Down from 14.5% in Aug, 15.4% in July, 15.3% in June, and 16.1% in May.
• Pre-Covid average: 15.5%.
✅ Fall-Throughs
• 6,149 fall-throughs last week (pipeline of 510k home Sold STC).
• Weekly average for 2025: 6,217.
• Fall-through rate: 24.6%, down from 25% last week.
• Long-term average: 24.2% (post-Truss chaos saw levels exceed 40%).
✅ Net Sales
• 19.4k net sales this week, up from 18.9k last week.
• Nine-year Week 39 average: 19.4k.
• Weekly average for 2025: 19.9k.
• YTD: 777k, which is 4.5% ahead of 2024 (743k) and 10% above 2017–19 (706k).
✅ Probability of Selling (% that Exchange vs withdrawal)
• Preliminary September Stats : 50% of homes that left agents’ books exchanged & completed. (Note this will change as more September stats come in in throughout October)
• August :55.8% / July: 50.9% / June: 51.3% / May: 51.7% / April: 53.2%.
✅ Stock Levels
• 751k homes on the market at the start of October, 4% higher than October 2024. (723k)
• 510k homes in sales pipeline on the 1st October, 2% higher than 12 months ago.
If you would like to chat about our local property market, feel free to drop me a call on 01282 772048 or email me at info@pendlehillproperties.co.uk