UK property market update: Week 43, 2025
The UK property market steadied in Week 43 of 2025, with listings and sales easing slightly as autumn settles in. Prices remain resilient, reductions level off, and activity stays above pre-pandemic norms - signalling a stable, balanced market.
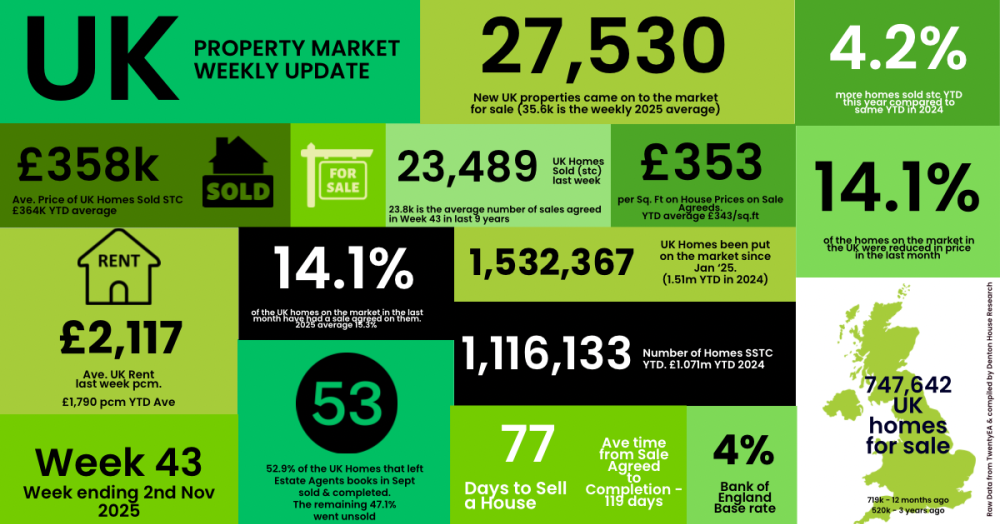
✅ New Listings
• 27.5k new properties came to market this week, down as expected from 29.3k last week.
• 2025 weekly average: 35.6k.
• Nine year week 43 average :29.1k
• Year-to-date (YTD): 1.53m new listings, 1.5% higher than 2024 YTD (1.51m) and 9.1% above the 2017–19 average (1.40m)
✅ Price Reductions
• 18.3k reductions this week, lower as expected, than last week’s at 21.3k.
• Increase in the number of homes on the market being reduced in September to 14.1% (these stats are always done a month in arrears). In August, it was 11.1% (everyone must have been on holiday!), whilst it was 14.1% in July and 14% in June.
(October figures to follow next week)
• 2025 average so far: 13.2%, versus the five-year long-term average of 10.74%.
✅ Sales Agreed
• 23.5k homes sold subject to contract this week, down as expected from 24.2k last week.
•Week 43 average (for last 9 years) :23.8k
• 2025 weekly average : 26k.
• YTD: 1.116m gross sales, which is 4.2% ahead of 2024 (1.071m) and 12.5% above the 2017–19 average (992k).
✅ Price Diff between Listings & Sales
• Average Asking Price of listings last week £398k vs Average asking price of Sales Agreed (SSTC)- £358k - a 11.2% difference (long term 9 year average is 16% to 17%)…
• The average listing price has dropped from £452k in Sept to £415k in October.. ie fewer expensive homes being listed
✅ Sell-Through Rate
• 14.1% of homes on agents’ books went SSTC in September. (October figures to follow in
November)
• Down from 14.5% in Aug, 15.4% in July, 15.3% in June, and 16.1% in May.
• Pre-Covid average: 15.5%.
✅ Fall-Throughs
• 5,278 fall-throughs last week (pipeline of 510k home Sold STC).
• Weekly average for 2025: 6,181.
• Fall-through rate: 24.2%, slightly down from 24.3% last week.
• Long-term average: 24.2% (post-Truss chaos saw levels exceed 40%).
✅ Net Sales
•18.2k net sales this week, down (as expected) from 18.3k last week.
• Nine-year Week 43 average: 17.9k.
• Weekly average for 2025: 19.8k.
• YTD: 850k, which is 3.6% ahead of 2024 (821k) and 9.5% above 2017–19 (776k).
If you would like to chat about our local property market, feel free to drop me a call on 01282 772048 or email me at info@pendlehillproperties.co.uk