UK property market update: Week 44, 2025
The housing market remains steady this week, with new listings, sales activity and price trends all tracking closely to seasonal norms. While reductions edge up and net sales dip as expected, overall 2025 performance continues to outpace last year and pre-Covid averages.
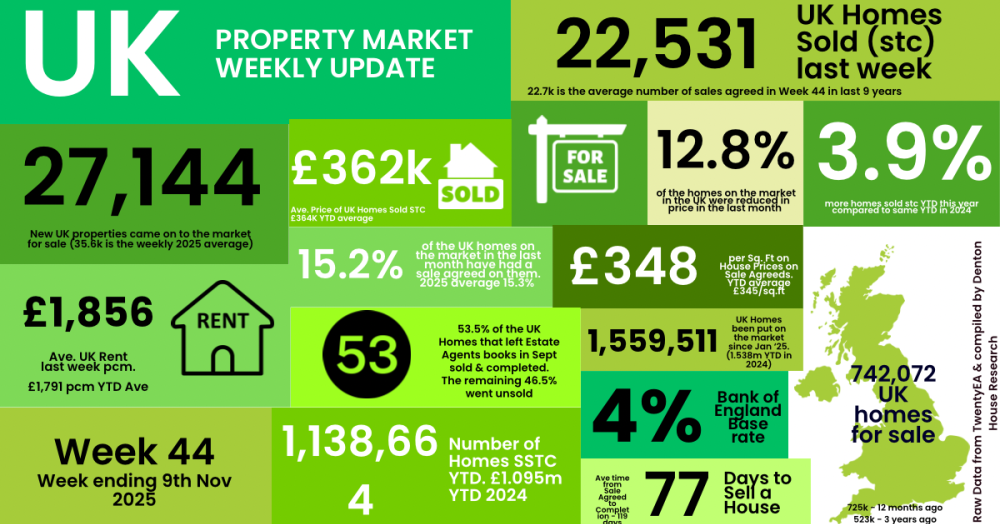
✅ New Listings
• 27.1k new properties came to market this week, down as expected from 27.5k last week.
• 2025 weekly average: 35.6k.
• 9 year week 44 average : 28k
• Year-to-date (YTD): 1.56m new listings, 1.4% higher than 2024 YTD (1.54m) and 8.9% above the 2017–19 average (1.43m)
✅ Price Reductions
• 18.5k reductions this week, slightly higher than last week’s at 18.3k.
• Decrease in the number of homes on the market as 12.8% of resi homes for sale were reduced in October. Compared to Sept 14.1%, August 11.1%, July 14.1% in July and 14% in June.
• 2025 average still remains at 13.2%, versus the five-year long-term average of 10.74%.
✅ Sales Agreed
• 22.5k homes sold subject to contract this week, down as expected from 23.5k last week.
• Week 44 average (for last 9 years) :22.7k
• 2025 weekly average : 26k.
• YTD: 1.137m gross sales, which is 3.9% ahead of 2024 (1.096m) and 12.5% above the 2017–19 average (1.012m).
✅ Price Diff between Listings & Sales
• Average Asking Price of listings last week £400k vs Average asking price of Sales Agreed (SSTC)- £362k - a 10.6% difference (long term 9 year average is 16% to 17%)…
• The average listing price has dropped from £452k in Sept to £415k in October.. ie fewer expensive homes being listed
✅ Sell-Through Rate
• 15% of homes on agents’ books went SSTC in September. Up from 14.1% in Sept, 14.5% in Aug, 15.4% in July, 15.3% in June, and 16.1% in May.
• Pre-Covid average: 15.5%.
✅ Fall-Throughs
• 5,975 fall-throughs last week (pipeline of 510k home Sold STC).
• Weekly average for 2025: 6,182.
• Fall-through rate: 26.5%, slightly up from 24.2% last week.
• Long-term average: 24.2% (post-Truss chaos saw levels exceed 40%).
✅ Net Sales
• 16.6k net sales this week, down (as expected) from 18.2k last week.
• Nine-year Week 44 average: 16.9k.
• Weekly average for 2025: 19.7k.
• YTD: 867k, which is 3.4% ahead of 2024 (839k) and 9.4% above 2017–19 (793k).
✅ Probability of Selling (% that Exchange vs withdrawal)
• Initial October Stats : 53.5% of homes that left agents’ books exchanged & completed in October. (Note this figure will change throughout the month as more October comes in)
• September: 53.1% / August :55.8% / July: 50.9% / June: 51.3% / May: 51.7% / April: 53.2%.
✅ Stock Levels
• 742k homes on the market at the start of November, 2.4% higher than November 2024. (725k)
• Notable increases include 9% more homes for sale in London than 12 months ago (9.96% in Inner London & 9.03% in Outer London) & 5.48% in the South East and 5.02% in the South West. The North has seen a drop in homes for sale.
• 511k homes in sales pipeline on the 1st November, 2.2% higher than 12 months ago.
If you would like to chat about our local property market, feel free to drop me a call on 01282 772048 or email me at info@pendlehillproperties.co.uk